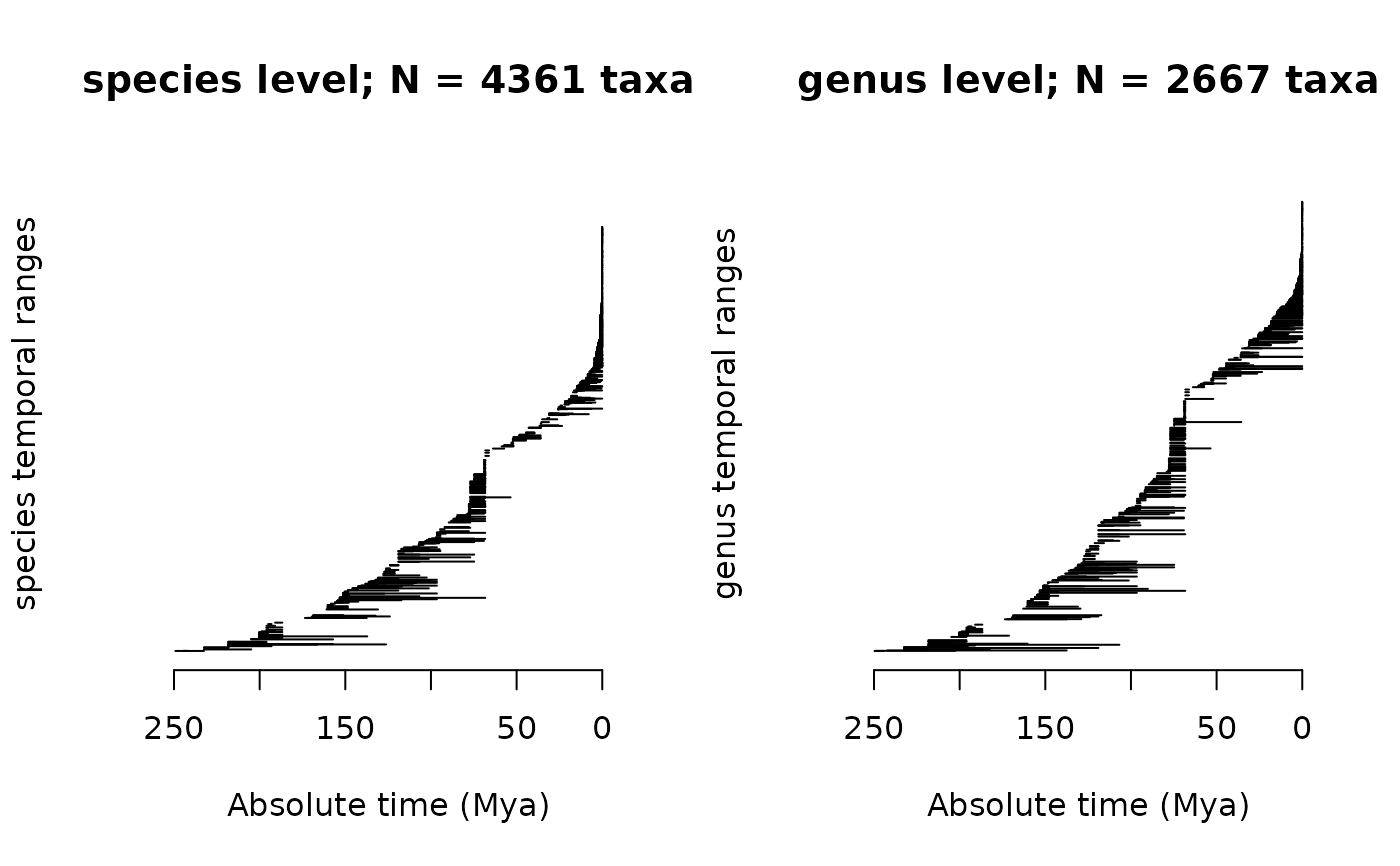
plotRawFossilOccs calculates and plots the early and late boundaries
associated with each taxa in a dataset.
Usage
plotRawFossilOccs(
  data,
  tax.lvl = NULL,
  sort = TRUE,
  use.midpoint = TRUE,
  return.ranges = FALSE,
  knitr = FALSE
)
Arguments
- data
A
data.framecontaining fossil data on the age (early and late bounds of rock layer, respectively labeled asmax_maandmin_ma) and the taxonomic level asked intax_lv.- tax.lvl
A
charactergiving the taxonomic in which calculations will be based on, which must refer to the column names indata. IfNULL(default value), the function plots every individual occurrences indata.- sort
logicalindicating if taxa should be sorted by theirmax_mavalues (default value isTRUE). Otherwise (i.e., ifFALSE), function will follow the order of taxa (or occurrences) inputted indata.- use.midpoint
logicalindicating if function should use occurrence midpoints (betweenmax_maandmin_ma) as occurrence temporal boundaries, a method commonly employed in paleobiology to remove noise related to extremely coarse temporal resolution due to stratification. This argument is only used if atax.lvlis provided.- return.ranges
logicalindicating if ranges calculated by function should be return as adata.frame. Iftax.lvlisNULL, the function don't calculate ranges and so it has nothing to return.- knitr
Logical indicating if plot is intended to show up in RMarkdown files made by the
KnitrR package.
Value
Plots a pile of the max-min temporal ranges of the chosen
tax.lvl. This usually will be stratigraphic ranges for occurrences
(so there is no attempt to estimate "true" ranges), and if
tax.lvl = NULL (the default), occurrences are drawn as ranges of
stratigraphic resolution (= the fossil dating imprecision). If
return.ranges = TRUE, it returns a data.frame containing the
diversity (column div) of the chosen taxonomic level, through time.