Plotting the whale phylogeny and coloring its clades
Source:R/plotPaintedWhales.R
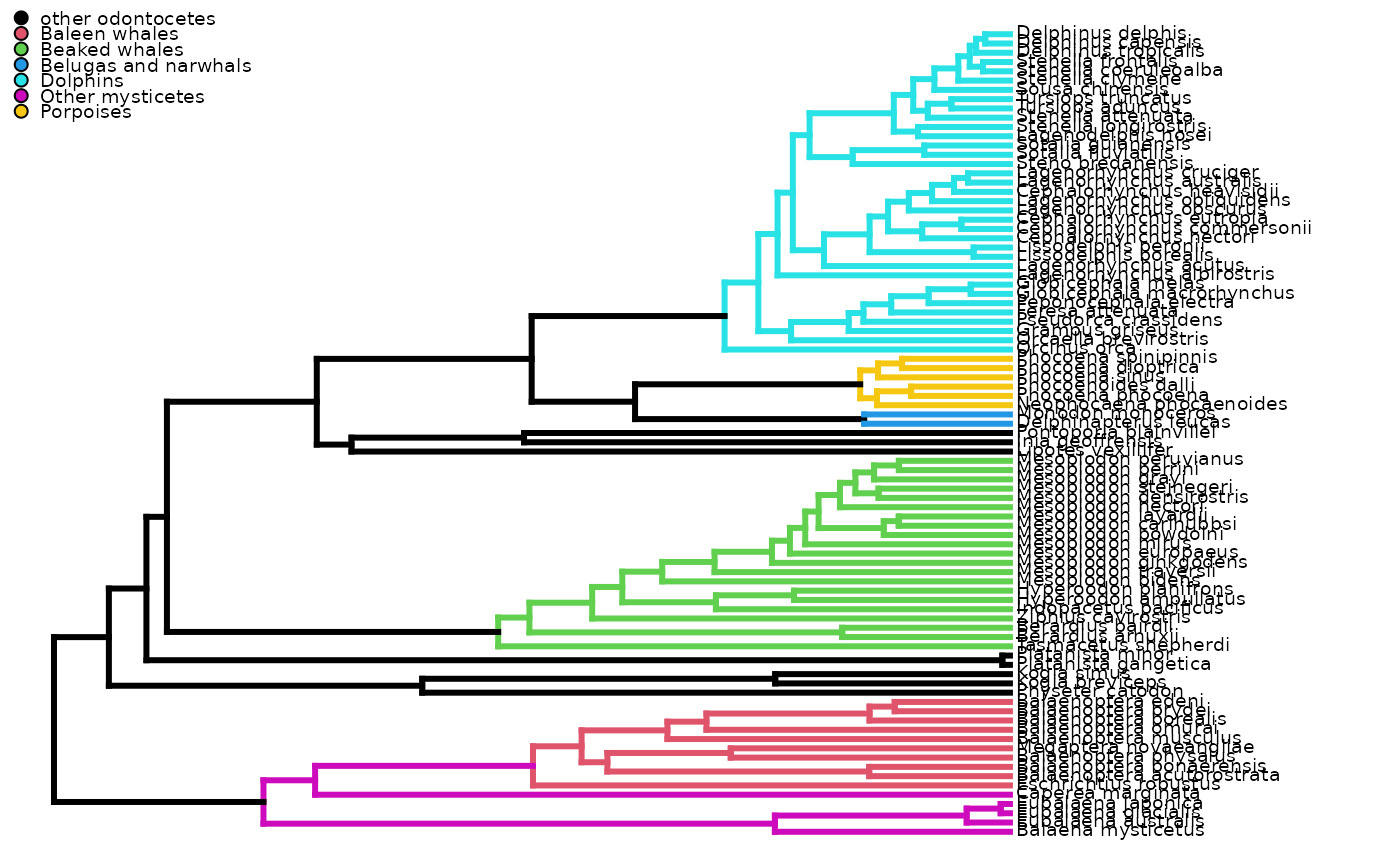
plotPaintedWhales.RdplotPaintedWhales plots the phylogeny from Steeman et al (2011), coloring the Dolphins (Delphinidae), porpoises (Phocoenidae), the Mysticetes, the baleen whales (Balaenopteridae), and the Beaked whales (Ziphiidae).
Arguments
- show.legend
Logical indicating if clade legend should be shown.
- direction
Phylogeny plotting direction. Should be set to "rightwards"
- knitr
Logical indicating if plot is intended to show up in RMarkdown files made by the
KnitrR package. (the default) or "leftwards".- ...
other arguments to be passed to
phytools::plotSimmap
References
Steeman, M. E., Hebsgaard, M. B., Fordyce, R. E., Ho, S. Y., Rabosky, D. L., Nielsen, R., ... & Willerslev, E. (2009). Radiation of extant cetaceans driven by restructuring of the oceans. Systematic biology, 58(6), 573-585.
See also
help page from phytools::plotSimmap
Other macroevolution:
calcFossilDivTT(),
checkAndFixUltrametric(),
countSeqDiffs(),
estimateSpeciation(),
fitCRBD(),
lttPlot(),
plotProteinSeq(),
plotRawFossilOccs(),
simulateBirthDeathRich(),
simulateTree()